The Normalized Difference Vegetation Index (NDVI), one of the most popular, is a valuable way to remotely understand vegetation health and land use. This article tells you what it is and how to use it.
| Table of Contents: |
1. What is the NDVI?
NDVI, or greenness index, shows vegetation’s greenness, density, and health in each satellite image pixel.
It has been one of the most widely used vegetation indices in remote sensing since its introduction in the 1970s, and digital agriculture is one of the industries that take the most advantage of it.
Thus, this index is suitable for estimating vigor throughout the crop cycle based on how plants reflect specific electromagnetic spectrum ranges. It allows us to know its current state and can be compared with another temporal image to observe its evolution over time.
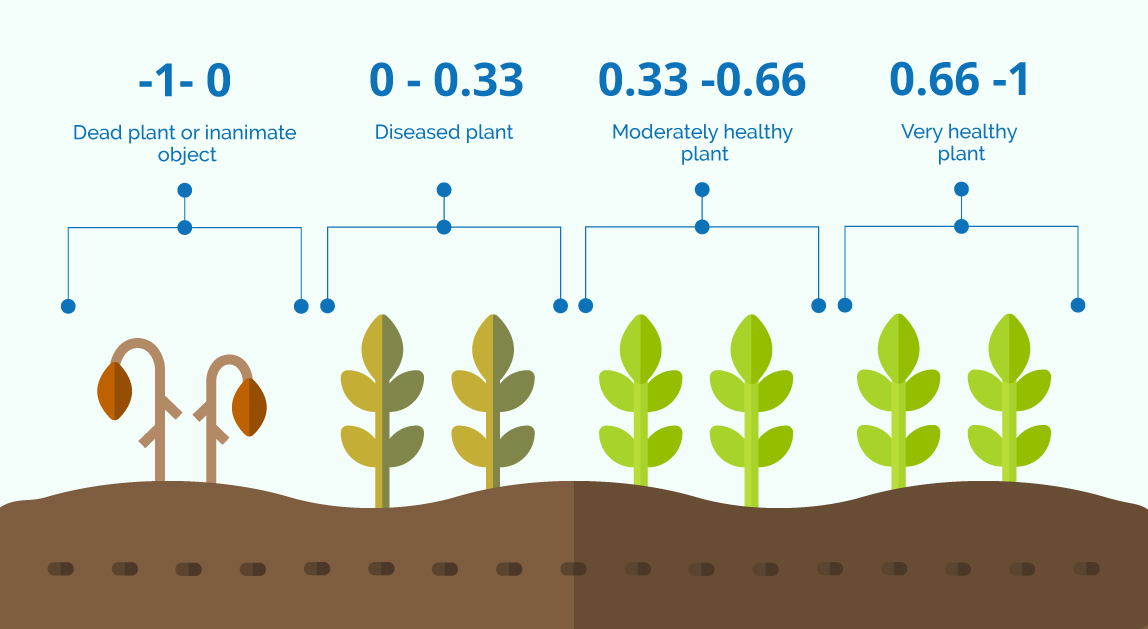
By knowing how NDVI works, we will understand how it allows us to determine how healthy or unhealthy a plant is. Based on how it reflects energy and light, it uses the near-infrared and red bands of the electromagnetic spectrum to estimate a dimensionless indicator between -1 and 1.
To the human eye, a plant is green because its chlorophyll pigment reflects green waves and absorbs red waves. Because of that, a healthy plant –with lots of chlorophyll and cell structures– actively absorbs red light and reflects NIR when photosynthesis occurs. The plant develops and grows and contains more cell structures. With an unhealthy plant, the exact opposite is true.
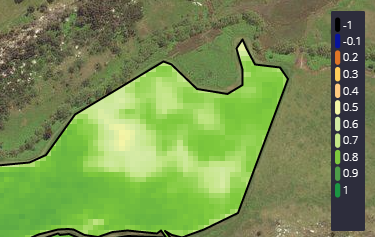
On our platform, the scale to the right of the field is the reference for crop vigor.
So, that relationship between light and chlorophyll is how we can use NDVI to differentiate a healthy plant from a diseased one.
Satellite sensors in space measure the wavelengths of light absorbed and reflected by green
plants. They are an excellent source of spectral signature data for NDVI analysis.
The NDVI index detects and quantifies the presence of living green vegetation using this reflected light in the visible and near-infrared bands.
The standard NDVI formula used to calculate it is:
NDVI = (NIR – red) / (NIR + red)
2. How to use NDVI? How does it vary according to crop condition?
The NDVI value ranges from -1 to 1 and shows the vigor of the crop:
- Values close to 1: the more intense the green, the more vigorous the vegetation and vegetation cover. We must consider whether we are working with extensive or intensive farming or if there is bare soil since the index will consider all this. It will also measure the vigor of the underbrush.
- Values close to 0: correspond to areas with very little vegetation, early stages of cultivation, bare soil, or non-productive areas.
- Negative values: usually associated with areas of water, snow, or clouds.
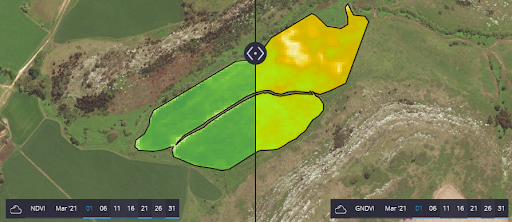
3. What is the GNDVI and how does it differ from NDVI?
GNDVI (Green Normalized Difference Vegetation) is an index of plant “greenness” or photosynthetic activity. It is a chlorophyll index used at later stages of development, as it saturates later than NDVI. It is one of the most widely used vegetation indices to determine water and nitrogen uptake in the crop canopy.
GNDVI is more sensitive to chlorophyll variation in the crop than NDVI and has a higher saturation point. It can be used in crops with dense canopies or in more advanced stages of development, while NDVI is suitable for estimating crop vigor during the early stages.
As with NDVI, the values given by this index also range from -1 to 1:
- Values between -1 and 0: are associated with the presence of water or bare soil. It is used mainly in the crop cycle’s intermediate and final stages.
- Values greater than 0: the more intense the green, the more vigorous the vegetation and vegetation cover.
As for how it is calculated, the GNDVI is the green vegetation index that uses the near-infrared (NIR) and green band (GREEN) of the electromagnetic spectrum.
GNDVI = (NIR-GREEN) /(NDVI+GREEN)
4. NDVI variants: NDRE, MSAVI2, and VISIBLE
NDRE (Normalized Difference Red Edge)
NDRE is an index similar to NDVI. It uses red-edged light that can penetrate leaves much more profoundly than red light (used in NDVI). That is the main reason because it’s a safer solution, as it can detect variations in crop health at more advanced stages. Thus, with a more intense canopy, it is advisable to use NDRE because NDVI saturates.
This index detects changes in chlorophyll content, one of the leading indicators of nitrogen inside the leaves.
NDRE = (NIR – RED EDGE) / (NIR + RED EDGE)
How is the NDRE used?
Although NDRE is an index closely related to NDVI, it allows us to identify vigor decreases earlier. It is also a helpful index in the advanced stages of the crop to generate nitrogen fertilization maps in the most affected areas.
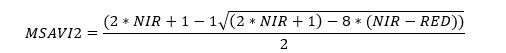
MSAVI2 (Modified Soil Adjusted Vegetation Index)
MSAVI2 is a vegetation index used as a variant to extend the application limits of NDVI to areas with a high presence of bare soil. It is used in areas where indices such as NDVI or NDRE provide incomplete or erroneous data, mainly due to a small amount of vegetation or lack of chlorophyll in the vegetation (e.g., in the phenological stage of emergence). In this way, it minimizes the influence of the soil background and increases the dynamic range signaled by the vegetation.
How is MSAVI2 used?
MSAVI2 is most recommended for the early stages of crop development, allowing us to observe the first seedlings emerging.
It minimizes bare soil’s influence, so it is ideal for early stages, such as crop emergence, crops that do not cover the soil in its most developed stage, or woody crops. This index allows us to be more efficient in using fertilizers during the early stages, reducing the environmental impact and increasing production significantly.
Visible (RGB)
Although our algorithms automatically detect cloudy images and filter them to prevent them from affecting the correct measurement, viewing the raw satellite image (RGB), also known as Visible, before drawing conclusions based on NDVI or any other index presented here is always advisable to corroborate that no clouds or overcast may be affecting.
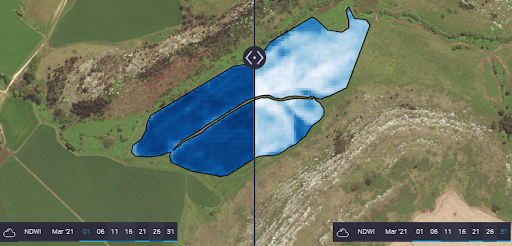
5. NDWI: The water index and how to use it
The NDWI (Normalized Difference Water Index) is used to monitor crop water status. It allows us to observe the water status of the crop and identify moisture deficit and saturation in the crop. This index uses green and near-infrared bands of satellite images. NDWI can improve water information efficiently in most cases. It is sensitive to soil accumulation and results in overestimation of water bodies. NDWI values can be used with NDVI to assess the context of apparent change areas.
NDWI=(NIR-SWIR) / (NIR+SWIR)
How is the NDWI used?
As with other indices, the values obtained for NDWI range from -1 to 1, where high values correspond to high plant water content and coverage of a large part of the plant, and low values represent low vegetation water content and sparse cover.
6. How can I visualize, understand, and analyze vegetation indices?
Although satellite information comes mainly from open sources, it requires excessively laborious processing work to calculate the indices and their visualization correctly. Even once these indices were visualized, it is necessary to interpret and correlate them with each other and other information sources to draw conclusions on our fields.
Visualize now the NDVI, GNDVI, and all the indexes presented here for any field in the world by registering for free at Auravant. Draw the field or farm to be analyzed, and you will have access to the most updated satellite images already processed along with all its history, visualizing it both on the map and in graphs with its historical evolution in the Crop Status. We will also send you alerts if our algorithms detect any significant variation, and you can even correlate it with other sources of information (e.g., yield maps) to make more accurate zonifications.