Knowing the crop status through satellite images is possible thanks to the vigor (NDVI) and chlorophyll (GNDVI) indices and the satellite image in visible light.
This functionality allows you to view the evolution curve of all multispectral indices including NDVI and GNDVI in HD over time and the accumulated precipitation to compare between years, campaigns and crops.
The vigor and chlorophyll indices (with their variants MSAVI2, NDRE and NDWI) will help to see how the crop is evolving, while the visible light will help to check that the image is free of clouds and to easily identify those particularities of the field (roads, grain silos, field boundaries, etc.).
It is also possible to download the historical information or in the period of time that is of interest, in Excel format to analyze it and compare it with other agronomic variables. In addition, own performance estimation/prediction models can be generated.
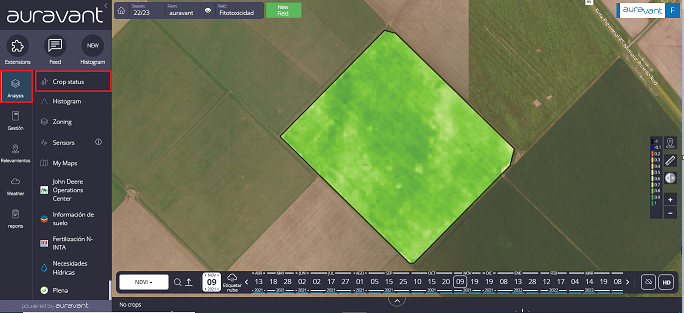
How to see the crop status of your field?
Click on “Crop Status” in the left side menu and access to the evolution of NDVI, GNDVI, MSAVI2, NDRE and NDWI. There you will be able to make a selection by crop, and view the evolution of the different indices available on our platform on the dates you want.
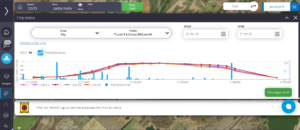
In the graph you will be able to see how the indices varied over time, the accumulated precipitation and analyze their behavior to evaluate the performance of fields or of a crop in different fields. To learn about the differences between NDVI and GNDVI, click here.
By placing the mouse on the graph, you will be able to see exactly how much each index is worth:
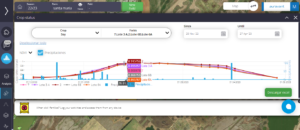
Then, you will be able to download the Crop Status in an Excel spreadsheet to analyze the evolution in a quick and easy way.
Watch the step by step in the following video:
“