The final process of sampling is the creation of maps and is carried out by means of an interpolation of the data obtained from said sampling.
In this feature, we use the Ordinary Kriging interpolation. Kriging is an interpolation method that assumes values based on the distance and direction of the sample points, where the closer points have a greater weight of interference than the more distant points.
The arrangement of the data and the points within the field is of utmost importance to generate the variogram for a correct interpolation. That is why each sampling can be particularly different from one another for the creation of a map according to how the variogram of that sampling is setup.
In this sense and for a better interpolation of the sampling, an automatic configuration is made with parameters that take into account the distribution, the values of the samples and size of the field, consequently allowing to obtain a variogram with the highest possible correlation.
How to create a sampling map?
1- Once all the data has been incorporated into the sampling groups, our sampling label will be marked as complete in the status section.
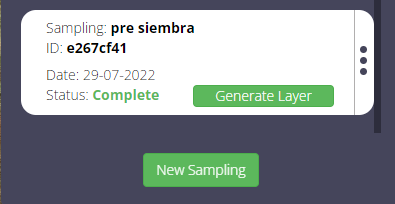
2- Now we can generate the layers to be incorporated into our collection, along with the satellite images, and be able to use them for our specific analyses.
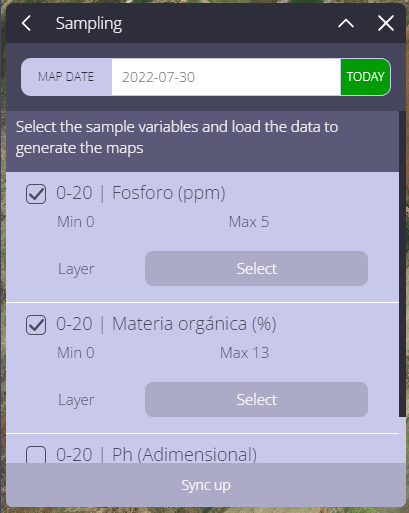
3- To do this, click on generate layer and select the analyzes you want to interpolate to generate the layers. In the case that we show here, we will select an analysis of organic matter and another of phosphorus in the soil, both measured at a depth of 20 cm and expressed in %.
4- Select the date of the analysis, check the boxes and select the group of layers where we want to incorporate these layers.
In this case, both layers will go in the soil group, one in the OM (Organic Matter) section and OM_20 (referring to the depth of the analysis).
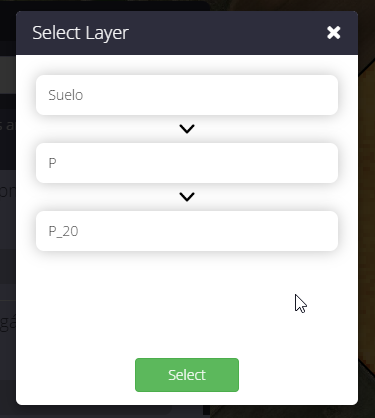
And on the other hand, the one related to the analysis of phosphorus, in the soil group, section P (phosphorus) and P_20 (according to the depth of the analysis).
5- Once this is selected we can click on “Synchronize”. There it will change to a green color and the interprolation analysis will be processed.
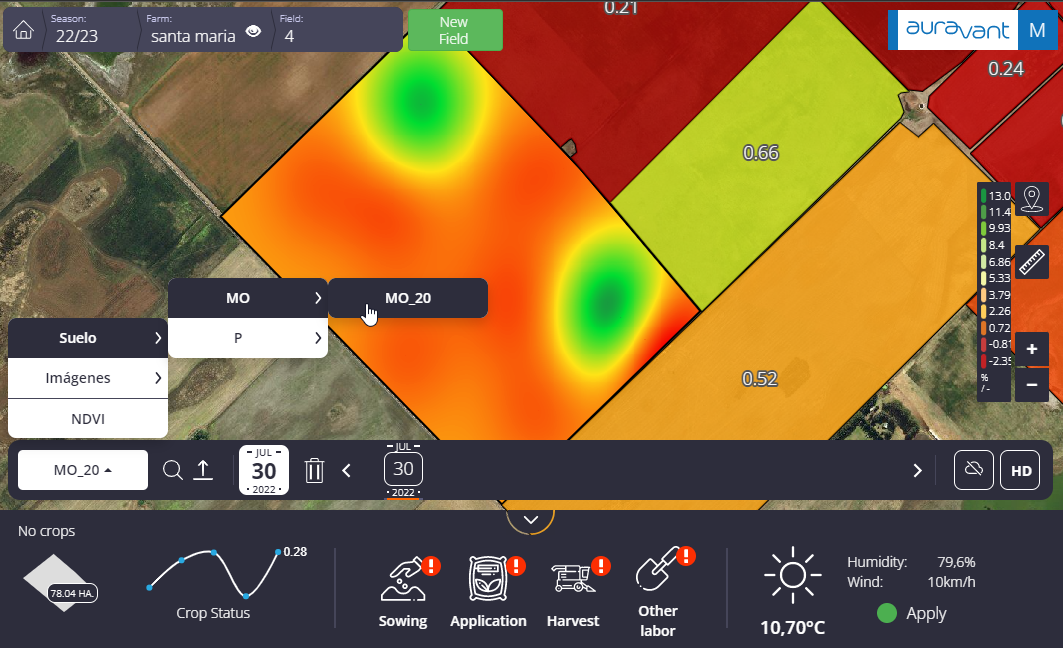
Once the process is finished, you can now consult these layers within the image selector in the bottom bar in the floor group.
“