A histogram is a statistical graph that represents the repetition of values grouped by classes.
The histogram in Auravant is a very useful feature to quickly visualize a batch based on the layer that is selected (ndvi, gndvi, yield, input application, altimetry, electrical conductivity, etc). It serves to easily relate values and areas of the lot, segmenting it into pseudo-environments or areas of interest based on data, minimizing intuition.
This allows decisions to be made based on 1 specific data such as an image or layer of limitations to productivity such as: depth of roughing, electrical conductivity, etc. For example, for the management of fertilization, especially nitrogenous, it is an excellent tool since it is highly mobile and spatially variable, so updated and granular information is required to later propose a replacement strategy.
The lots will be divided into areas that present little internal variability and high differentiation with other regions, highlighting particular characteristics.
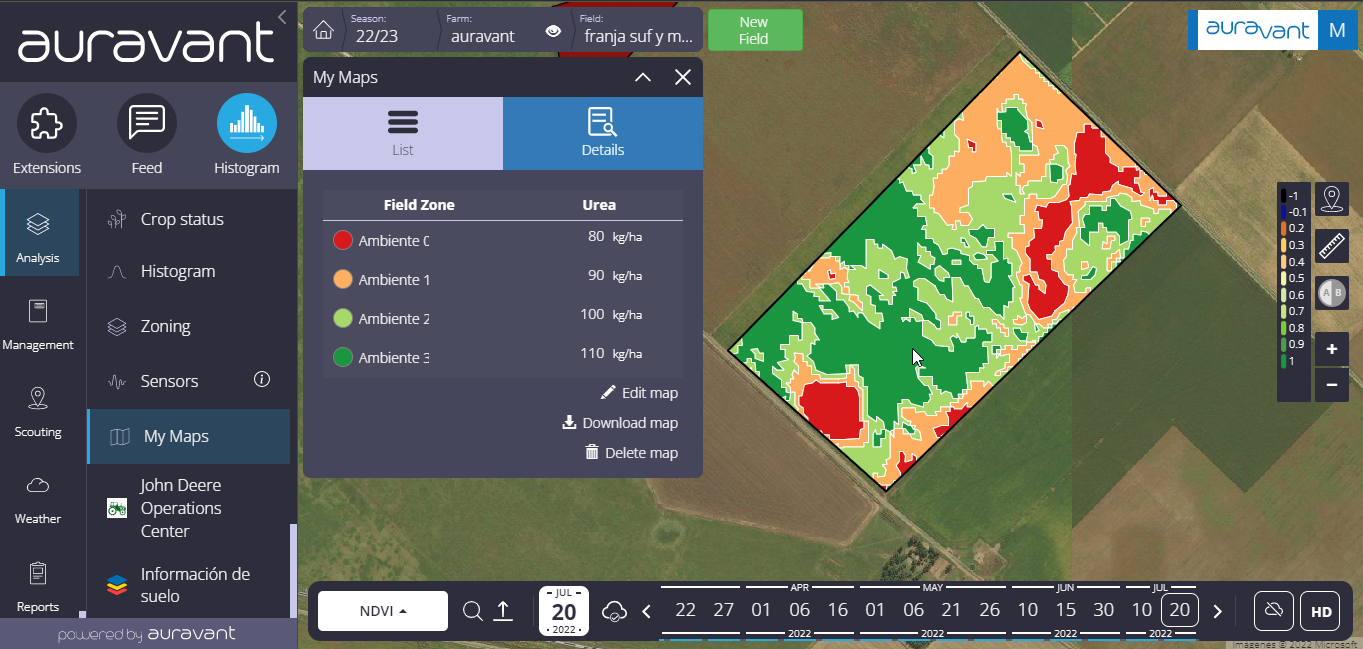
In turn, it is important to note that after segmenting the field into sectors it is possible to assign inputs and generate a variable application prescription.
How to use the “Histogram” tool?
1- Enter the “Analysis” module and create your “Histogram” from 1 specific data such as an image or layer of limitations to productivity.
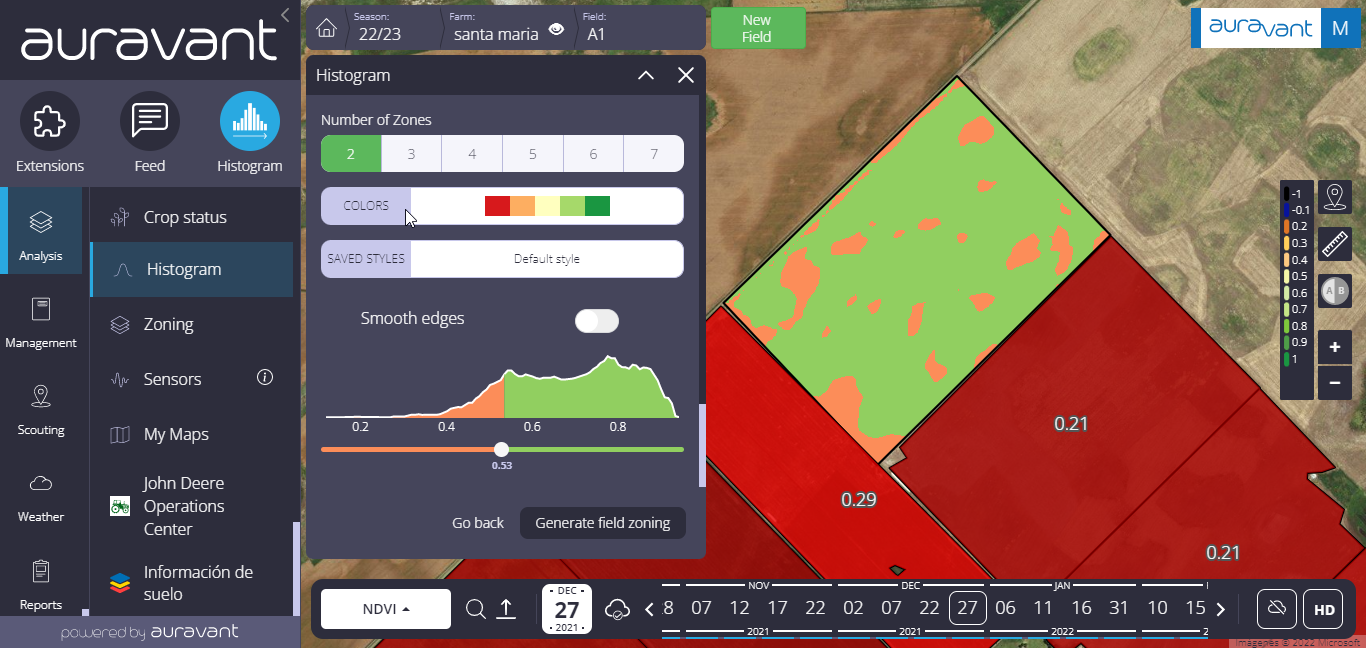
2- The first thing you have to do is define the number of environments. (In the histogram it is represented on the Y axis, the frequency of values of the mentioned layer, on the X the grouped hectares and on the slider, the minimum and maximum value of each range).
3- Customize your histogram with the available tools:
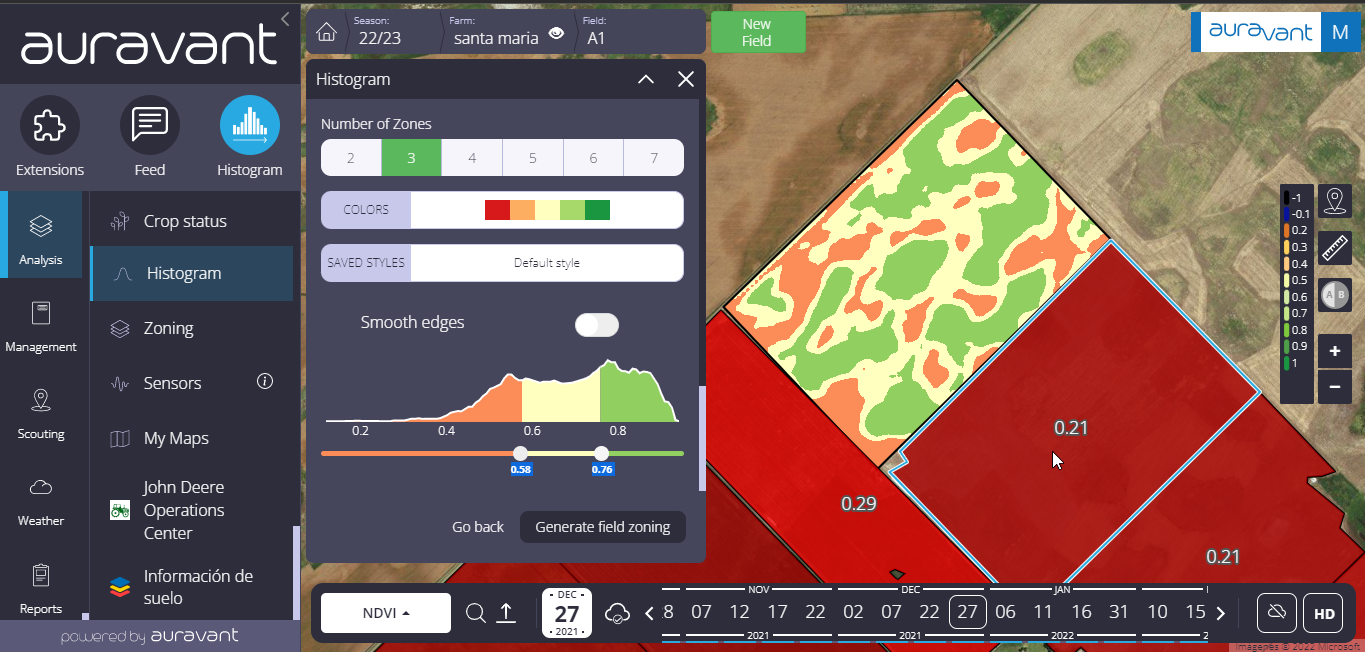
Addition of zones (ranging from 2 to 7 zones/environments)
Layer smoother (removes points to create a simpler map)
Color ramps (has a color blind scale)
Store classification styles (the ranges of values with which the data segmentation is made to create the different environments are saved)
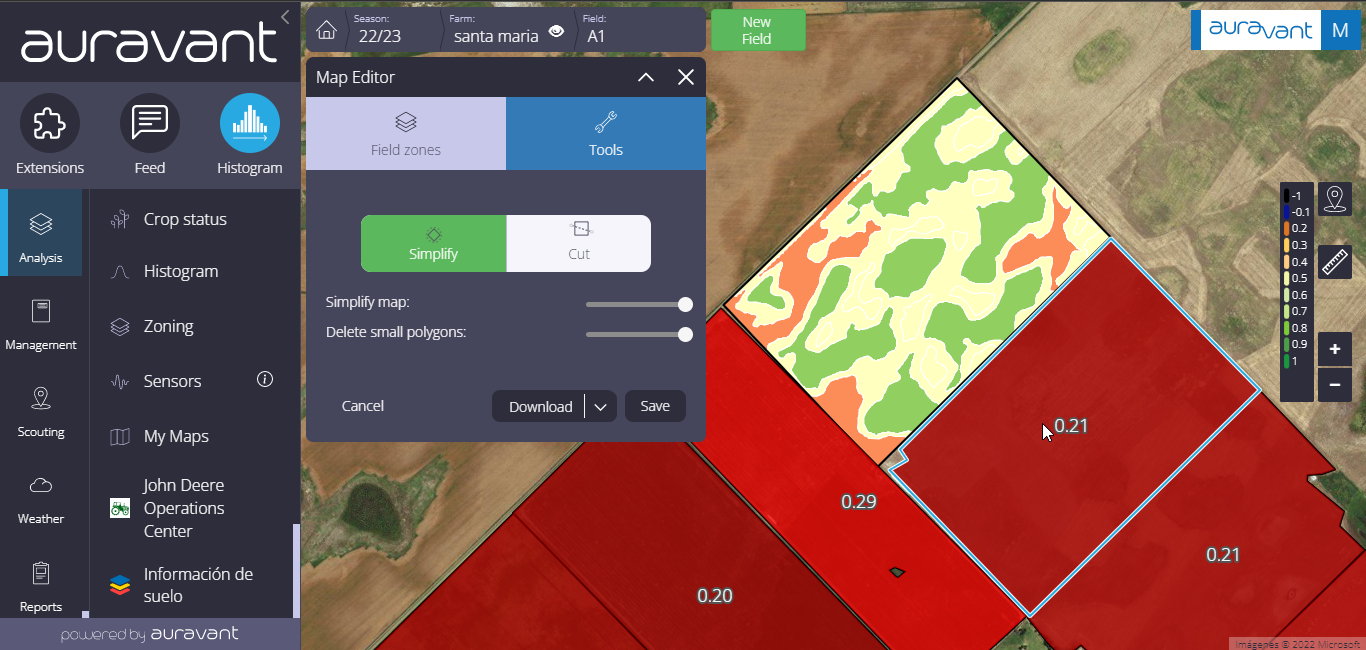
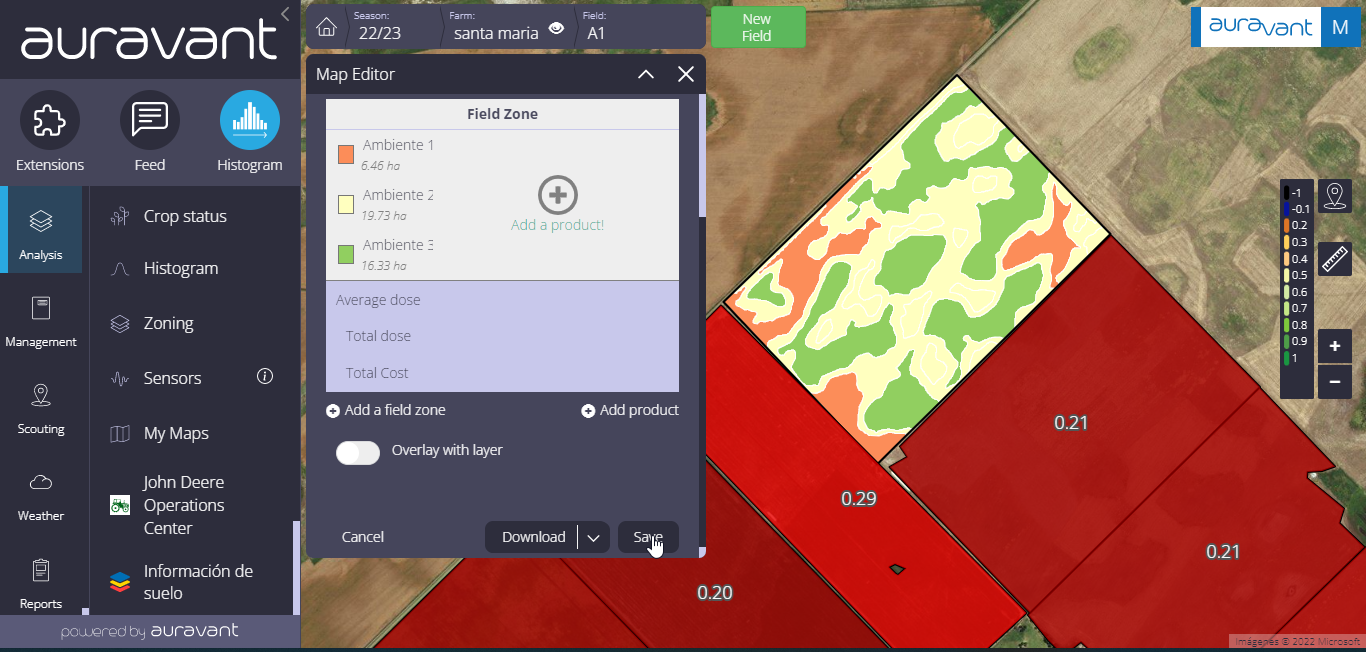
4- Once you have defined the customization of your histogram, press “Save setting”.
In the following video we will show the step by step to be able to use the histogram:
“