The “Sampling” tool allows creating georeferenced points in the farm, making specific maps and identifying the distribution of variables in the field in order to take corrective and/or preventive actions.
How does Sampling work?
The tool allows to perform different types of analysis (e.g., soil analysis A: 0-20 and B: 20-40) with their respective variables (e.g., analysis A: phosphorus, PH, organic matter and analysis B: nitrogen) and to group the different points to perform (grab or composite samples).
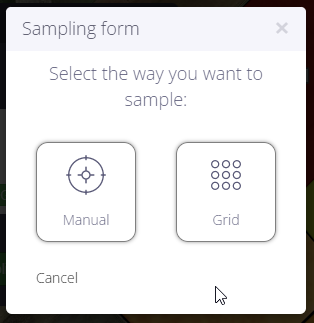
Select the Sampling feature in a field. There, you will have to choose how you want to perform the sampling: Manual or in Grid.
Manual
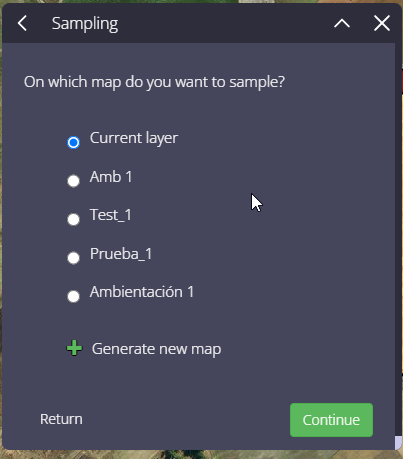
Selecting “Manual” will open a window that will allow you to sample based on a satellite image or a previously generated zoning map (you can also generate a new zoning map that will redirect you to the zoning feature).
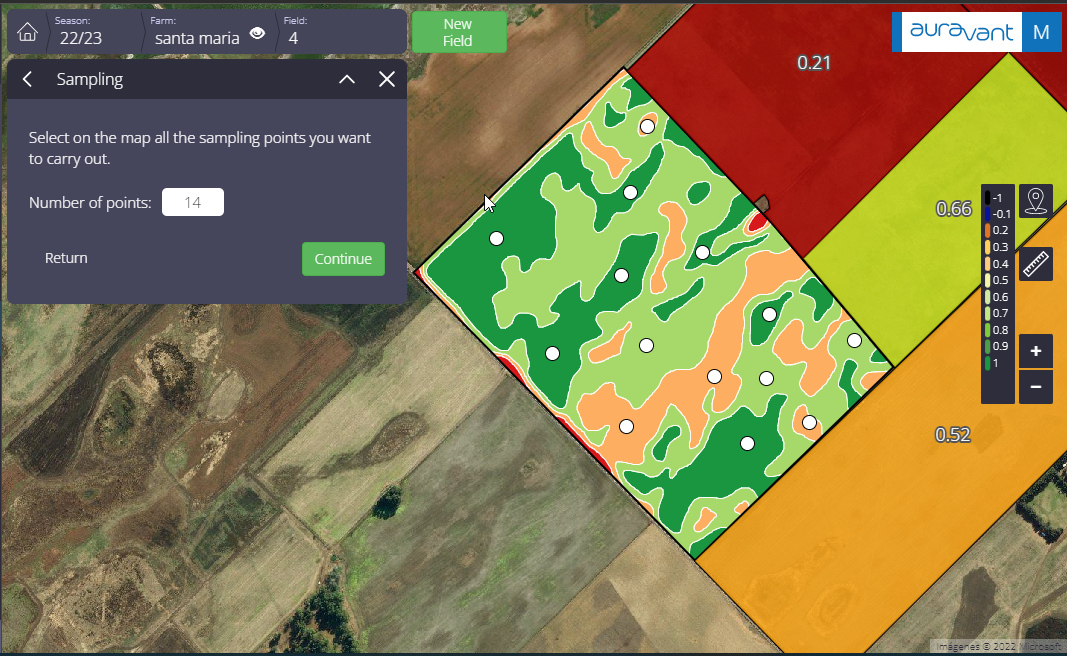
Once the map is selected, it will be displayed and you will have to mark all the points where you want to perform the field work.
You can also move a generated point by clicking and dragging it to another area; or you can delete a point by clicking on it.
Grid
When selecting “Grid”, the sampling is automatically performed on the current layer where the user is located. A window will open where you must enter the number of points to be sampled per surface, generating them equidistant according to the surface of the field.
At the same time, you can rotate the grid to adapt it to the best geometry of your field with the “Rotate Grid” feature.
You will also be able to edit points. This feature will allow you to delete or move them as you see fit.
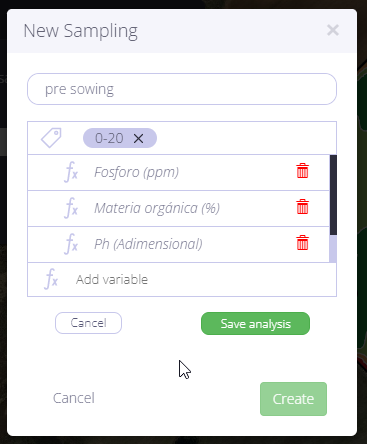
2. When selecting the “continue” button, you must load the analyses to be included in the sampling and the variables of each analysis (soil, weeds, insects, yield, etc.). These analyses, together with their variables, will impact all points.
Sampling name
Type of analysis
Variables to be analyzed
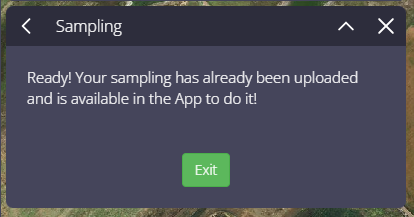
Once the respective sampling analyses have been created, the data will be synchronized with the mobile app and the sampling will be uploaded to be carried out in the farm.
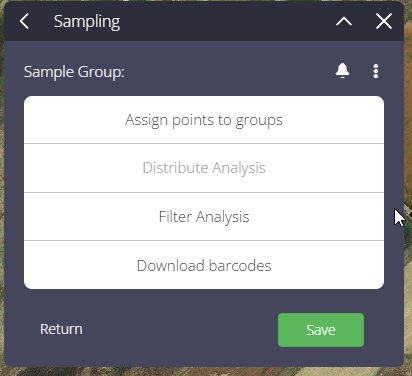
In the event that you need to organize the work to be carried out in the field from the web, what you must do is enter the newly created sample and click on the 3 points in the upper right margin so that the following options appear:
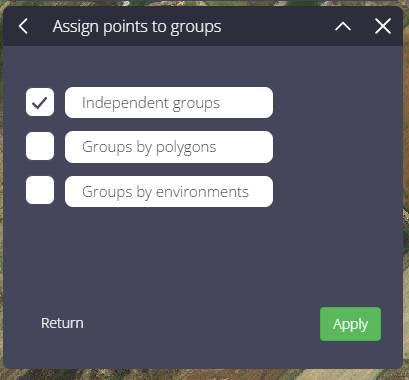
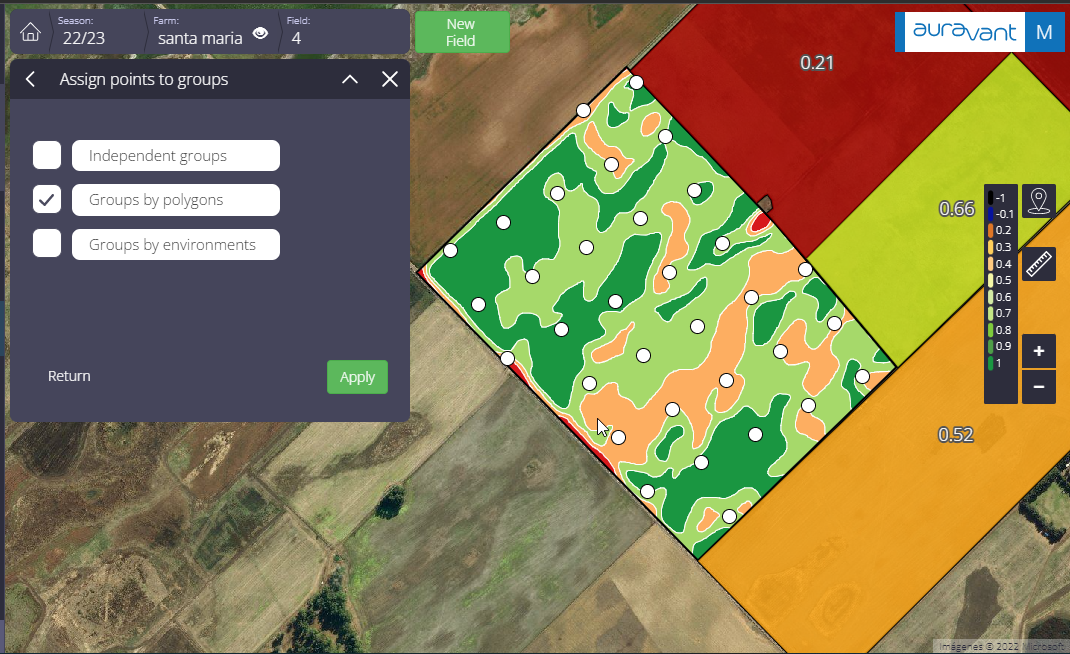
Assign points to groups
Distribute Analysis
Filter Analysis
Assign points to groups: here you can select by polygon or independently.
Distribute and filter analysis
With this function, what we will do is attribute the percentage that will be made of each analysis in the sampling, allowing an automatic and uniform distribution throughout the batch.
Ex: In the sampling, 100% of all the points will be carried out, the analyzes of the depth 0-20cm and 50% of the points with the depth 20-40 cm.
“