Introduction
The images in high definition allow the user to view vegetation indexes with a resolution that is almost 10 times better than standard images and as frequently as every 2 days depending on the climate factors.
Resolution
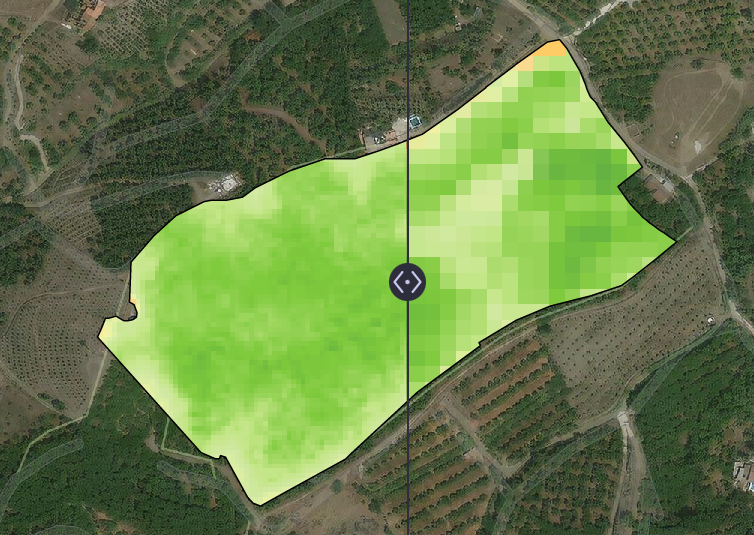
The resolution of the images in high definition is 3 x 3 m per pixel (9m2). From these, it is possible to analyse fields more accurately and to identify variability in situations adjusted to the type of crop or the scale of field work required.
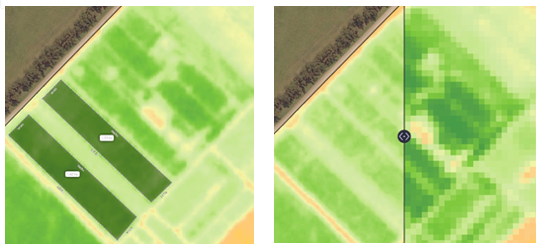
The image below shows a comparison between the Standard Definition “SD” (10 x 10m) on the right and the High Definition “HD” (3 x 3m) on the left.
Would you like to quote HD images for your field?
Leave us your phone number and we will contact you:
What would you use HD images for?
Frequency of Images
The images are displayed very frequently, almost daily, which allows the user to have more information about the crops in important and critical periods, where the capturing and registering of information becomes key to generating maps of production zones, predicting yields or detecting problems that may be affecting the crop.
The following image shows the frequency of SD images, between 4-10 days between one image and another. All SD images are underlined in blue.

In the case of HD, in the following image it can be seen how the availability of HD images is greater than the case of SD. They are all underlined in red.

En el caso de querer filtrar exclusivamente la visualización de las imágenes en HD, hay que hacer click en el icono: HD.

Would you like to quote HD images for your field?
Leave us your phone number and we will contact you:
What would you use HD images for?
Uses
High-definition images make it possible to detect and visualize foci of weeds that are fallow, accurately delimit flooded areas due to some climatic event, analyze fertilization tests or crops of different varieties, among others. others.
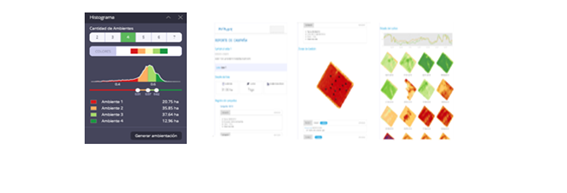
Functions
By definition, Auravant´s functions generate value from the images available. Therefore, the high-resolution images enhance the tools of the web platform and the mobile app. Some examples are the definition and accuracy when defining environments and prescriptions as well as the number of images available that can be included in the reports.
Spectral Bands
The images have spectral bands in red, green, blue and infrared. And so, it is possible to view the vegetation indexes that are obtained from equations involving these bands, such as, NDVI, GNDVI and MSAVI2.
If you are interested in knowing more, leave us your contact information and we will get in touch:
What would you use HD images for?