Here are the keys to using our star tool: the histogram. In this article, you will find its uses and some practical examples that will help you gain efficiency.
The histogram is the most used tool of our platform. To learn how to use it and get the most out of it, we are going to tell you what it is used for and how to apply it in agricultural work, with concrete examples that will facilitate your understanding. You will also learn how to use it to estimate yield and, specifically, how the Auravant histogram works.
| Table of content: |
1. What is a histogram and how to apply it in agriculture?
The histogram is a graph that shows how the data of a statistical sample or population are distributed. Mathematically speaking, it is a graphical representation that symbolizes the repetition of values grouped in numerical intervals or according to absolute values.
Applied to agriculture, the histogram allows us to classify your fields in different field zones based on the use of satellite images (either provided by the Auravant platform or layers that we have uploaded). Thus, the histogram groups those parts of the field that are within the same range of loaded values.
By segmenting the field into pseudo-field zones or zones of interest based on digital data, we are able to minimize intuition and increase accuracy.
See more: What is the histogram?
2. What is the histogram used for? Concrete examples of its use
The histogram allows us to quickly segment an image or layer of information into zones or zonings. In this way we can:
- Set with any type of map:
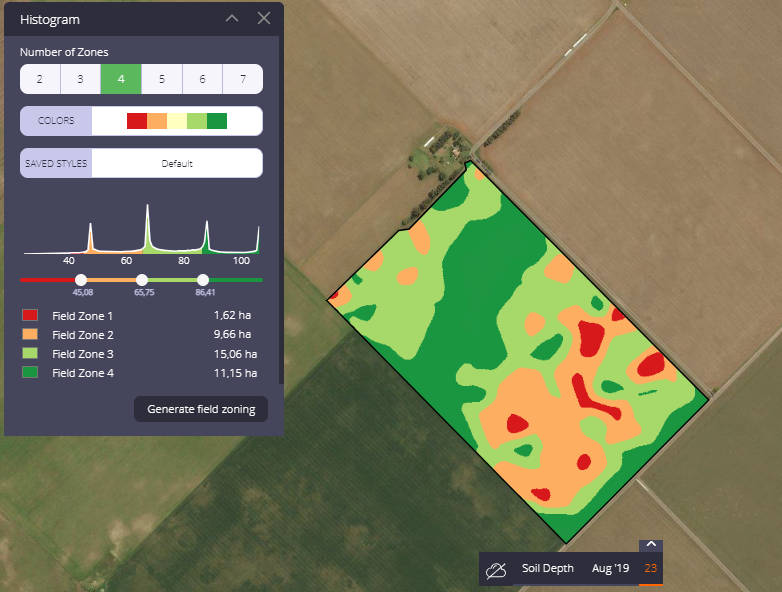
1. Soil depth map
2. Yield Map
- Zone through a single NDVI image (as opposed to the field zone itself where we must use at least two layers of information):
- See information that at first glance we cannot differentiate. E.g.: Post-planting yield potential using MSAVI 2 vs. NDVI:
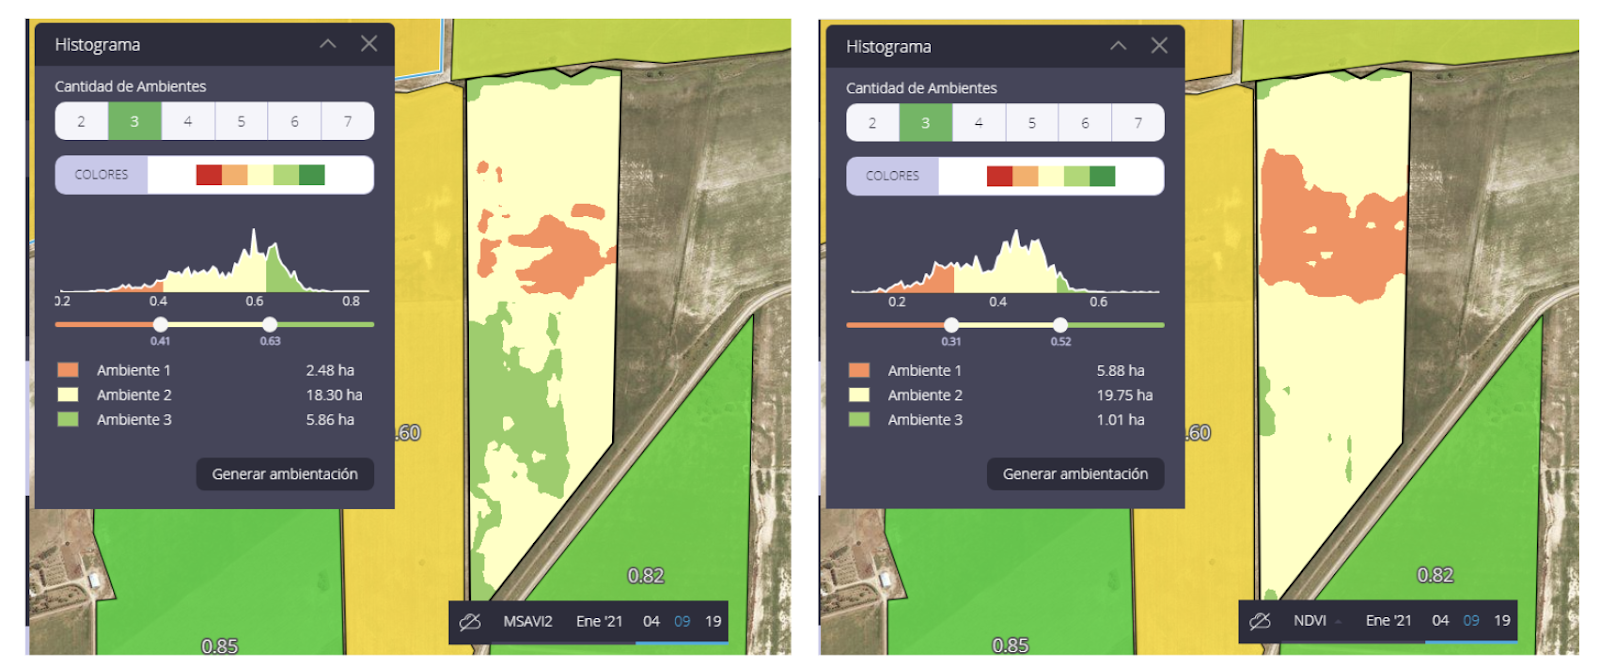
In this case, we see two histograms of the same date, but with different satellite indices. MSAVI 2 has a soil correction factor that shows us, 10 days before, which zone will have the highest productive potential.
3. How can I estimate performance using the histogram?
One of the utilities of the histogram is the possibility of yield estimation. Recall that this tool allows us to quickly visualize a graph of the fields based on their NDVI index (vegetation vigor indicator). Thus, we can easily relate values and areas by generating work zones or field zones based on the processed information.
These zones of interest or pseudo-field zones present little internal variability and high differentiation with other regions, and highlight particular characteristics. Therefore, the histogram can be used as an isoproductivity map to estimate the yield to be obtained in the current season.
By using an NDVI image corresponding to the critical period of the crop, we can divide the image into as many isoproductivity zones as we need, using the histogram.
You will have to choose at least three points per zone to take field samples, with the help of the Auravant mobile app.
The yield estimate for each zone is obtained by multiplying the estimated average yield in that zone by the area of that zone. The histogram gives the area under the curve for each isoproductivity zone.
See more: How to estimate performance using the histogram
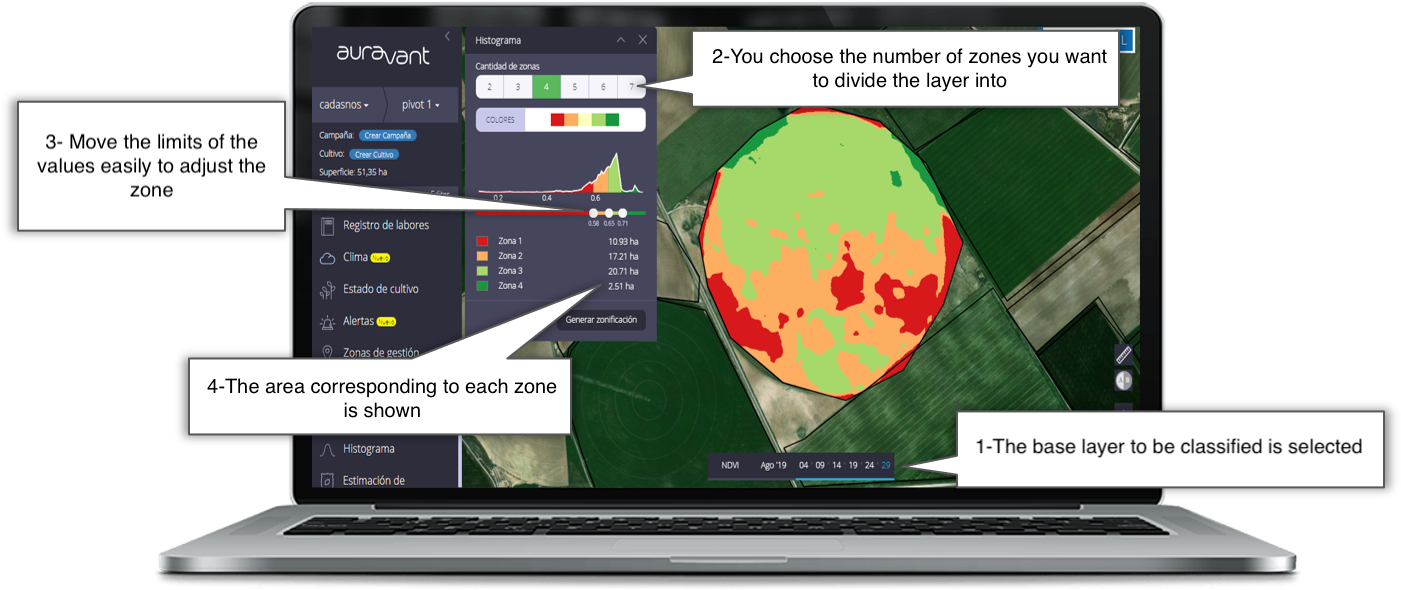
4. How does the Auravant histogram work?
The histogram in Auravant is a very useful feature to quickly visualize a field based on the layer that is selected (it can be a vegetation index provided by our platform such as NDVI, GNDVI or a layer uploaded by users, such as a yield layer, input application, altimetry, electrical conductivity, among others).
The fields will be divided into areas that present little internal variability and high differentiation with other regions, where particular characteristics are highlighted that could not be observed at first sight.
If you want to learn more about how it’s done in Auravant we invite you to our help center
………..
If you are not registered yet, we invite you to try our platform
If you want to contact us, here is the support email: hola@auravant.com